1 - General Information
- Current Filename: new_iced.exe
- Original Filename: Now Wardoor.exe
- SHA256:
76CD290B236B11BD18D81E75E41682208E4C0A5701CE7834A9E289EA9E06EB7E - Virustotal Score: 58/72
- Filetype: executable, 32-bit, GUI
- Filesize: 145 920 bytes
2 - Basic Static Analysis
2.1 - Summary
- There are few imports (initially only
KERNEL32.dllandole32.dll) - Based on the entropy of the different sections and strings mainly being compiler strings (not much code at all) the program seems likely to be packed.
- Watch out for:
IsDebuggerPresent
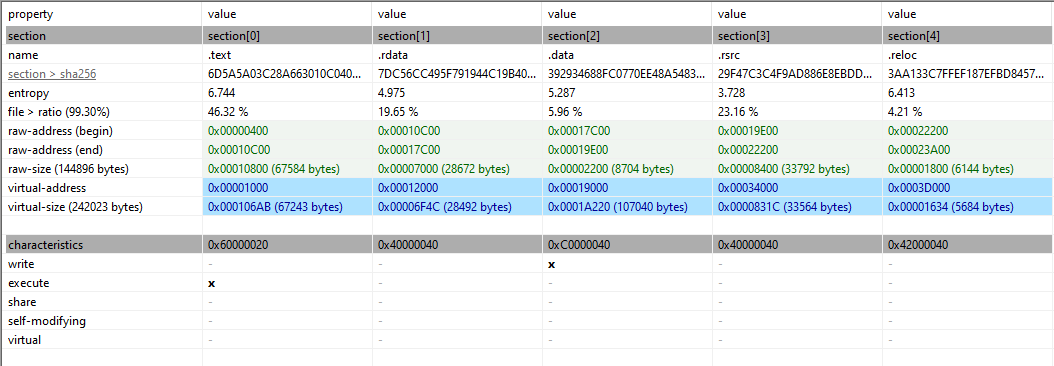
2.2 - Sections
There’s not so much to gather from the sections. We can see that the .rsrc section has a size of 33 564 bytes which is interesting.
3 - Code Analysis
Tip
Inside the tool “CFF Explorer” we can disable ASLR. Go to “Optional Header” → “DllCharacteristics” → “Click here” , then you can uncheck the box that says DLL can move to disable ASLR. Then save/overwrite original file. Makes life much easier.
3.1 - Summary
- We found some interesting functions inside of
WinMain()that we will look at using dynamic code analysis. - There is a lot of anti-analysis functions taking place.
3.2 - Function Analysis
Opening the program inside of IDA Pro 9.3 we investigate the Exports tab and see an entry to the public start function located at 0x4024EE.
WinMain()
This is the user-defined entrypoint for a GUI-application.
Anti-Assembly: loc_40E3A0
From inside the WinMain() we have a call to the region call loc_40E3A0. When we look at this region we might ask ourselves why this is not a function displayed by IDA. When we try to make this into a function we get the following message:
.text:0040EFE2: The function has undefined instruction/data at the specified address.
Your request has been put in the autoanalysis queue.
Weird, we can then take a look at this memory location:
.text:0040EFBB loc_40EFBB:                             ; CODE XREF: .text:0040EFAB↑j
.text:0040EFBB                 mov     edi, dword_41ACEC
.text:0040EFC1                 mov     edx, edi
.text:0040EFC3                 sub     edx, esi
.text:0040EFC5                 sub     edx, 3Fh ; '?'
.text:0040EFC8                 mov     dword_41A200, edx
.text:0040EFCE                 cmp     esi, 80739Ah
.text:0040EFD4                 jnz     loc_40F079
.text:0040EFDA                 cmp     edi, 62D6400Ch
.text:0040EFE0                 jnz     short loc_40F004 // <-- This will always be true and take the jump!
.text:0040EFE0 ; ---------------------------------------------------------------------------
.text:0040EFE2                 dw 5A8Fh // Garbage code (anti assembly!)
.text:0040EFE4                 dd 158B0000h
.text:0040EFE8                 dd offset dword_41A200
.text:0040EFEC ; ---------------------------------------------------------------------------
.text:0040EFEC                 mov     bl, byte_41AEA5
.text:0040EFF2                 mov     bh, byte_41AEA3
.text:0040EFF8                 mov     ecx, dword_41A20C
.text:0040EFFE                 mov     edi, dword_41ACEC
Now, based on the code above we can see that the jnz at will always take the jump. But IDA don’t understand this and thinks this could “fall through” to the garbage code below. However, this is an anti-assembly trick where a debugger always have to check both outcomes. To fix this, we can click on each of the three lines to undefine the code and then patch the jnz to a jmp instead as shown below:
.text:0040EFDA                 cmp     edi, 62D6400Ch
.text:0040EFE0                 jmp     short loc_40F004
.text:0040EFE0 ; ---------------------------------------------------------------------------
.text:0040EFE2                 db  8Fh
.text:0040EFE3                 db  5Ah ; Z
.text:0040EFE4                 db    0
.text:0040EFE5                 db    0
.text:0040EFE6                 db  8Bh
.text:0040EFE7                 db  15h
.text:0040EFE8                 db    0 ; OFF32 SEGDEF [_data,41A200]
.text:0040EFE9                 db 0A2h
.text:0040EFEA                 db  41h ; A
.text:0040EFEB                 db    0
.text:0040EFEC ; ---------------------------------------------------------------------------
.text:0040EFEC                 mov     bl, byte_41AEA5
.text:0040EFF2                 mov     bh, byte_41AEA3
Now since we fixed the code, we can go to the address 0x40E3A0 to make the loc_40E3A0 into a function.
More pain: sub_40E3A0
This function consists of multiple useless loops that do nothing other than provide overhead and complexity. We also have a Sleep() function being called with a timer set to 1380 ms. This will be called 8 times, so we must wait approximately 11 seconds for execution. An on top of that we have a loop running 16 986 550 times, just doing completely useless math.
So what can we do? Well, we can at least patch the 1380 ms and set it to 1 ms instead. There might be a state machine or something important going on with that other huge loop, so we won’t touch that one. Further on, we have a call loc_40FB10 sitting inside of this huge mess. That might be interesting.
Now would be a good time to look at this code by using dynamic analysis as this anti-analysis is getting tedious. Let’s use x32dbg for this.
4 - Dynamic Analysis
4.1 - Settings & Breakpoints
Based on our work up until this point we will set some breakpoints at the following locations:
WinMain()sub_40E3A0loc_40FB10
We will also set up the following breakpoints to catch any potential interesting allocations that malware often use to store or move encrypted/decrypted payloads, configurations etc. (For more infromation see this note)
VirtualAllocVirtualProtectCreateProcessInternalWIsDebuggerPresent
4.2 - Shellcode
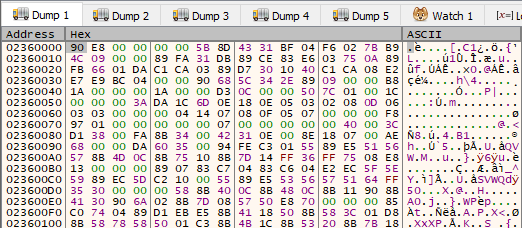
The first breakpoint we hit after the entrypoint is a VirtualAlloc call. We return from this function to see the return value which points to a memory address that contains shellcode at the second breakpoint (2nd VirtualAlloc). The shellcode is shown below:
- It starts with
90= nop - Then
E8 00 00 00 00which is a call (E8) to a relative adress (4 bytes = 0) so this effectively calls the instructions beginning with5B 8Detc.
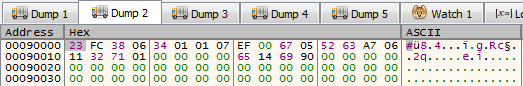
4.3 - Unknown
The address returned by the second VirtualAlloc points to this data which is currently unknown. But this might be some form of result used for later.
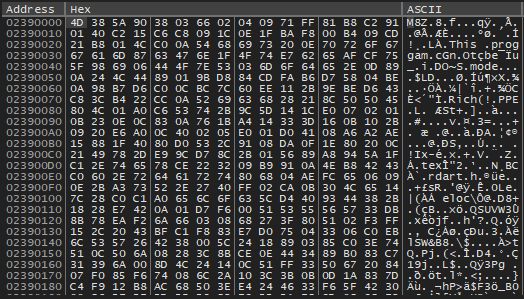
4.4 - Compressed Executable
The address pointed to by the third call to VirtualAlloc gives us the compressed executable (Starting almost with MZ, but instead M8Z). So we need to locate the un-compressed executable. This has a size of 0x3000, which we can use when we dump the file (we can find this value by looking at the pushed arguments before the VirtualAlloc call)
4.5 - Uncrompressed Executable
After hitting VirtualProtect the first time, after we saw the compressed executable from the return value of the previous (3rd) VirtualAlloc, we can do:
Execute till returnStep into(since we land at a ret instruction that will take us back to the “main code”)
Now we are here:
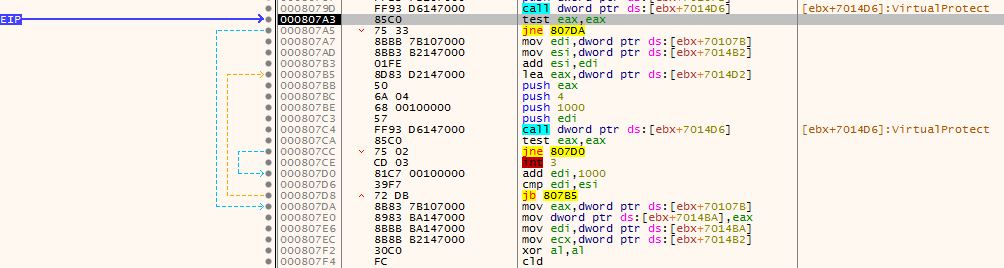
So as you can see, we have the call above the EIP which points to VirtualProtect we just returned from, now we need to look for a buffer that will store the un-compressed executable. After checking the buffers in the mov statements, we found one that looks to be correct:
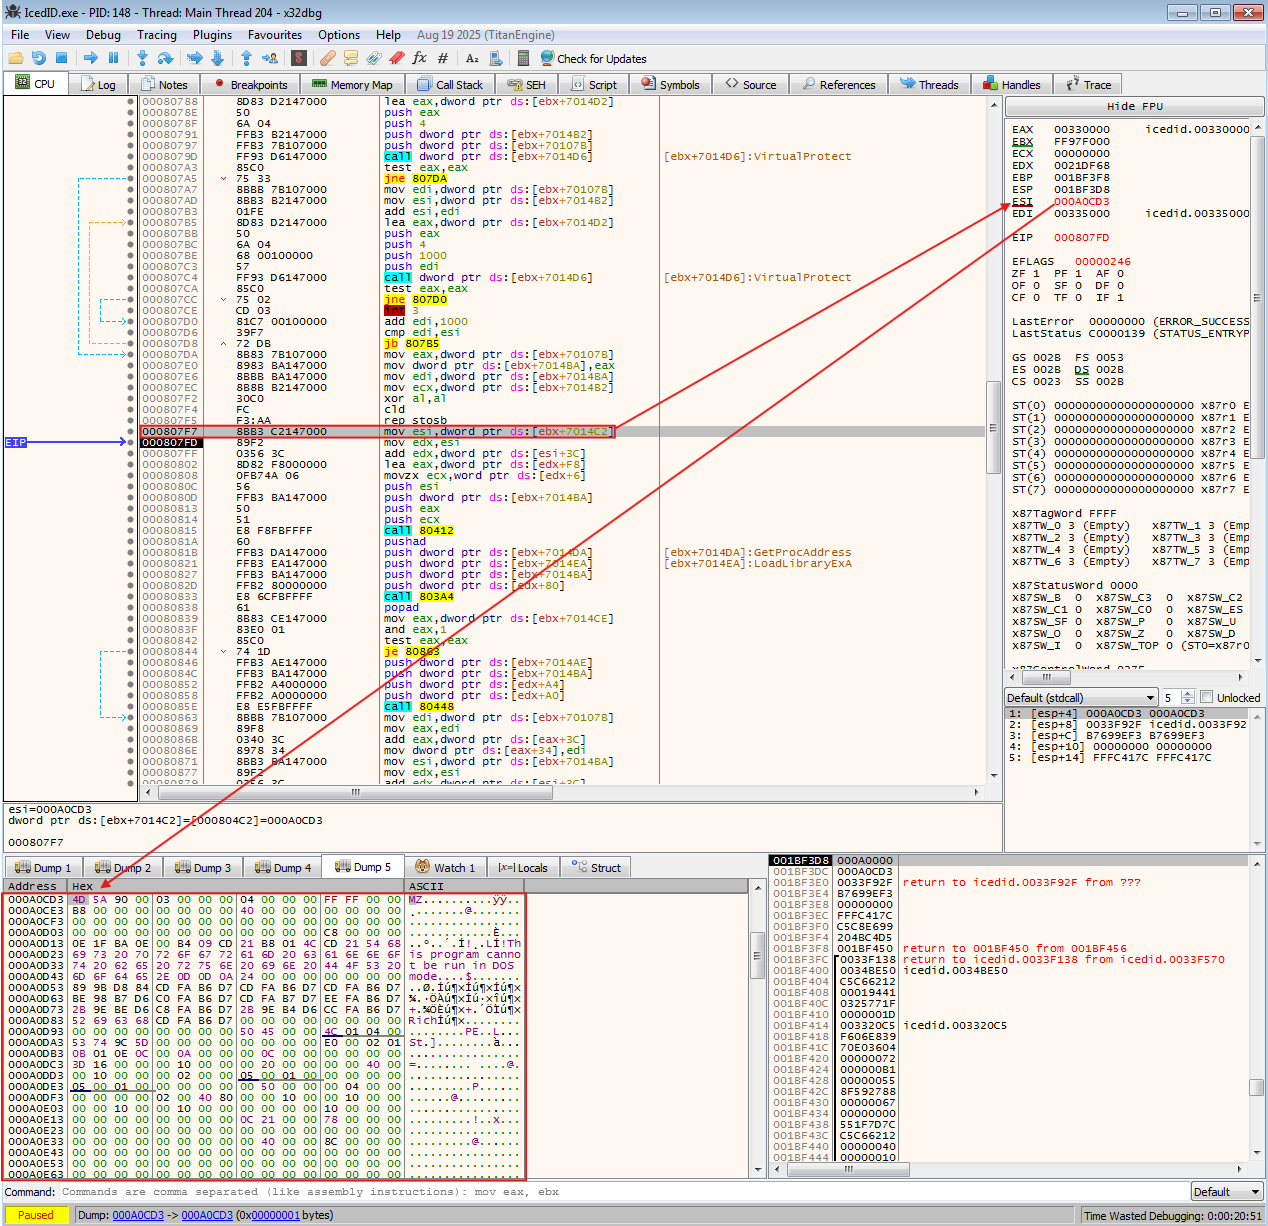
We then dump out this file by selecting the region in the Dump 5 window above, and then “save to file”. The file I dumped had a size of 0x3000 bytes based on the 3rdVirtualAlloc call we found earlier containing the compressed executable. We can now end our x32dbg session and continue with some code analysis.
5 - Code Analysis of the IcedID Loader
- VirusTotal Link & Information
- SHA256:
E6623BB43F0E491A2D2B12B895E047815B8C3518FA07A44971F21625BB6221C6
5.1 - Anti Analysis: VM
For one of the functions we have this psuedocode which I have commented and made some renames. This essentially creates a fingerprint of the environment to determine if the malware is running on a physical CPU or virtual machine. The result would be the following:
- Output String :
"%0.2X%0.2X%0.2X%0.2X%0.2X%0.2X%0.8X" - Output String explained :
[Thermal] [Bin <250] [Bin <500] [Bin <750] [Bin <1000] [Bin >1000] [Hypervisor Sig]
Timing Loop
Timing loop (rdtsc & cpuid) : The core of this function is the do...while loop that runs 255 times, it performs a timing attack. The __rdtsc reads the CPU’s time-stamp counter (the number of clock cycles since reset). The cpuid is the trap. On a real computer this instruction is fast, but on a VM, cpuid is a “privileged” instruction that causes VM-Exit. The Guest OS has to pause, control switches to the Hypervison (the host), the Hypervisor handles the request and switches back. The result is that this takes significantly longes than executing the instruction natively.
Histogram
The function doesn’t just average the time, it creates a distribution (a histogram) of how long the calls took. This helps filter out system noice.
- v24 : Fastest (< 250 cycles) ; likely Native/Bare Metal
- v20 : Slowest (>= 1000 cycles) : Likely Virtual Machine If the histogram shows a high number in v20 or v21, the malware knows it is being analyzed in a VM.
Thermal Sensor Check (v25)
Calling cpuid with EAX=6 queries Thermal and Power Management features. Bit 0 indicates if a Digital Thermal Sensor is supported.
- Logic: Real modern Intel CPUs almost always have thermal sensors. Many basic VMs do not emulate this hardware feature. If
v25is 0, it’s a red flag.
Hypervisor Vendor Check
Calling cpuid with 0x40000000 is the standard method to ask “Am I in a hypervisor?“.
- If virtualized, this returns the Hypervisor signature (e.g., “KVMKVMKVM”, “Microsoft Hv”, “VMwareVMware”).
- If native, this usually returns the standard CPU manufacturer ID or the instruction falls through to standard behavior.
5.1.1 - Anti VM FUnction
int __thiscall sub_4010F6(CHAR *this)
{
  int n255; // ebp
  unsigned __int64 start_timer; // kr00_8
  int _EAX; // eax
  unsigned __int64 elapsed_cycles; // rax
  int _EAX; // eax
  int _EAX; // eax
  int _EAX; // eax
  int _EAX; // eax
  unsigned __int8 v20; // [esp+16h] [ebp-26h]
  unsigned __int8 v21; // [esp+17h] [ebp-25h]
  unsigned __int8 v22; // [esp+18h] [ebp-24h]
  unsigned __int8 v23; // [esp+19h] [ebp-23h]
  unsigned __int8 v24; // [esp+1Ah] [ebp-22h]
  unsigned __int8 v25; // [esp+1Bh] [ebp-21h]

  v20 = 0;
  v21 = 0;
  v22 = 0;
  v23 = 0;
  n255 = 255;
  v24 = 0;
  do
  {
    start_timer = __rdtsc(); // Read Time Stamp Counter: inc by every clock cycle since last CPU reset
    _EAX = 1;
    __asm { cpuid }
    elapsed_cycles = __rdtsc() - start_timer;
    if ( HIDWORD(elapsed_cycles) )
      goto LABEL_11;
    if ( (unsigned int)elapsed_cycles < 250 )
    {
      ++v24;
      goto LABEL_12;
    }
    if ( (unsigned int)elapsed_cycles < 500 )
    {
      ++v23;
      goto LABEL_12;
    }
    if ( (unsigned int)elapsed_cycles < 750 )
    {
      ++v22;
      goto LABEL_12;
    }
    if ( (unsigned int)elapsed_cycles >= 1000 )
LABEL_11:
      ++v20;
    else
      ++v21;
LABEL_12:
    --n255;
  }
  while ( n255 );
  _EAX = 6;
  __asm { cpuid }
  v25 = _EAX & 1;
  _EAX = 0x40000000;
  __asm { cpuid }
  return wsprintfA(this, "%0.2X%0.2X%0.2X%0.2X%0.2X%0.2X%0.8X", v25, v24, v23, v22, v21, v20, _EAX);
}
5.2 - RC4 Encryption
5.2.1 - RC4 KSA (sub_40180F)
We have the usual RC4 Key Scheduling Algorithm, which initializes the S-box. This is easily seen by the characteristic double loop as shown in the image below. We also have some looping constants such as two loops with 0x100 (256).
5.2.2 - RC4 Key (sub_4014F9)
Now we can try to find the RC4 key. Looking at the function sub_4014F9 we can see it calling another function sub_40186E which seems to be calling the RC4_KSA. Now, for RC4 to work we need to also generate and output the keystream, this is done by the RC4 PRGA. We can rename the function sub_40186E to RC4_PRGA.
Now looking at sub_4014F9 we can see it calls RC4_PRGA with an argument v4. This is seen from the psuedocode below:
...
v4[0] = &byte_403000;  // Offset 0x00: Pointer to the RC4 Key
v4[1] = 8;             // Offset 0x04: Length of the RC4 Key
v4[2] = &dword_403008; // Offset 0x08: Pointer to the input data (Ciphertext)
v4[3] = 584;           // Offset 0x0C: Length of the input data
v4[4] = &dword_403008; // Offset 0x10: Pointer to the output buffer
if ( !RC4_PRGA(v4) )
...
Based on this, we can see that the key is 8 bytes long and is located at 0x403000. This location is shown below:
.data:00403000 byte_403000     db 0E3h                 ; DATA XREF: sub_4014F9+86↑o
.data:00403001                 db 0DCh
.data:00403002                 db  67h ; g
.data:00403003                 db 0A2h
.data:00403004                 db  13h
.data:00403005                 db 0F3h
.data:00403006                 db 0F1h
.data:00403007                 db 0C4h
And here is the key: 0xE3DC67A213F3F1C4 or for use in a python script: b"\xE3\xDC\x67\xA2\x13\xF3\xF1\xC4". Now since we have the key, key-length, encrypted data location and the size of encrypted data we can create a script to dump the config!
6 - Config Extractor
Below we have:
- Identified where the config is stored
- Use the correct encryption algorithm (RC4) to decrypt the payload. The first 8 bytes is the key, the rest is the encrypted payload.
- Then we extract the relevant strings from the decrypted payload and we get the C2 domains / config.
from arc4 import ARC4
import re
import pefile


def config_extract(filename):

    pe = pefile.PE(filename)
    for section in pe.sections:
        if section.Name.strip(b'\x00') == b'.data':
            return section.get_data()

def RC4_Decrypt(key, data):

    cipher = ARC4(key)
    decrypted = cipher.decrypt(data)
    return decrypted.strip(b'\x00')

def main():
    filename = input("Filename: ")
    data = config_extract(filename)

    if data:
        key = data[:8] # first 8 bytes are the rc4 key
        encrypted_payload = data[8:592] # the rest are encrypted data

        decrypted_payload = RC4_Decrypt(key, encrypted_payload)

        # use regex to find the relevant url's
        strings = re.findall(rb"[a-zA-Z0-9./\-_]{4,}", decrypted_payload)

        print("\n--- Extracted Config ---")
        for s in strings:
            # Decode bytes to string for a clean print
            print(s.decode('utf-8', errors='ignore'))
    else:
        print("Couldn't find data.")

if __name__ == '__main__':
    main()
And here is the result by retrieving the data, decrypting and parsing. We get the C2 domains:
PS C:\IcedID > uv run .\rc4.py
Filename: IcedID.exe

--- Extracted Config ---
/index.php
boldidiotruss.xyz
nizaoplov.xyz
153ishak.best
ilu21plane.xyz